2. Introduction
XD Metrics on Demand (XDMoD) provides metrics pertaining to resource utilization and performance of high performance computing (HPC) resources, and the impact these resources have in terms of scholarship and research. While initially focused on the National Science Foundation (NSF) TeraGrid and follow-on XSEDE (XD) and ACCESS programs, XDMoD has a wide applicability to any HPC system. The goals of XDMoD framework are to
1. Provide the end-user community with a tool to more effectively and efficiently use their allocations and optimize their use of cyber-infrastructure (CI) resources.
2. Provide operational staff with the ability to monitor and tune the performance of hardware , system software, and applications to ensure optimal resource performance.
3. Provide management with a diagnostic tool to facilitate CI planning and analysis as well as monitor resource utilization and performance.
4. Provide metrics such as publications, awards, and citations to help ensure that the resources are effectively enabling research and scholarship.
The framework also provides a computationally lightweight and flexible application kernel auditing system that reflects best-in-class performance kernels to measure overall system performance with respect to existing applications that are being run by users. This allows continuous resource usage analysis and measurement of all aspects of system performance, including: global file-system performance, local processor-memory bandwidth, allocable shared memory, processing speed, and network latency and bandwidth.
Metrics that focus on scientific impact, such as publications and external funding, are also included to help demonstrate the important role such centers play in advancing research and scholarship as well as to help justify the continued investment in these resources.
2.1. XDMoD User Interface Overview
Here we provide a brief introduction to the XDMoD user interface. Greater detail is provided throughout the manual. The XDMoD user interface, shown in Fig. 2.1, is organized into multiple tabs that provide functionality tied to the role of the user.
XDMoD utilizes user roles to restrict access to data and elements of the user interface such as tabs. Supported roles include a public (unauthenticated user), User, Principal Investigator, and Center Director. A detailed description of each role as it applies to data access is as follows.
In addition, the ACCESS version of XDMoD includes a Campus Champion and Program Officer roles.
Public Role: With no user account required, the public role provides non-authenticated users with access to overall utilization broken down by center or service provider (if more than one are available), resource, field of science, allocation time, etc.; and the ability to view specific time periods, and export images. Quality of service data via the Application Kernel suite is not publically available, nor is specific user data.
User: Users are able to view all data available to the Public Role as well as their personal utilization information. They are also able to view information regarding their allocations, quality of service data via the Application Kernel Explorer, and generate custom reports.
Principal Investigator (PI): A principal investigator is a user who is listed as a PI on one or more allocation or project. A PI has access to all data available to a user, as well as detailed information for any users included on their allocations or project.
Campus Champion: The campus champion role is still a work in progress. A typical campus champion will include one or more users on their allocations while assisting them, giving the champion the same access to detailed information about those users that a PI would have. we will be collaboration with the Campus Champion working group to develop other tools to facilitate their work in the future.
Center Director/Center Staff: The director of a service provider or center will have access to detailed usage information for any user that has run jobs at their center. In addition, they will have access to detailed application kernel results for runs at their center. Directors are also able to delegate access to their center’s data to other users who assist in the operations of their center. Directors may also have access to other information for their center to ensure that the proper information is being consistently reported.
Program Officer/ACCESS Management: Program Officers and ACCESS management have no restrictions on the information available to them. They may view data across all service providers, including data reporting compliance reports and custom queries (both described below).
The XDMoD User Interface contains a wealth of information and has been organized into tabs to compartmentalize the data without overwhelming the user. For illustrative purposes, we will focus on the highest level role. The tabs which are described in greater detail below are: Summary tab, Usage tab, Metric Explorer tab, Allocations tab, App Kernels tab, Report Generator tab, Custom Query tab, Job Viewer tab, and Compliance tab.
The Summary Tab (Fig. 2.1) provides a snapshot overview of selected data with several small summary charts visible that can be expanded to full size charts through a simple mouse click. The default is to show utilization over the previous month, but the user may select from a number of preset date ranges (week, month, quarter, year to date, etc) or choose a custom date range. The user can also customize the summary by adding charts, see the section on the Metric Explorer
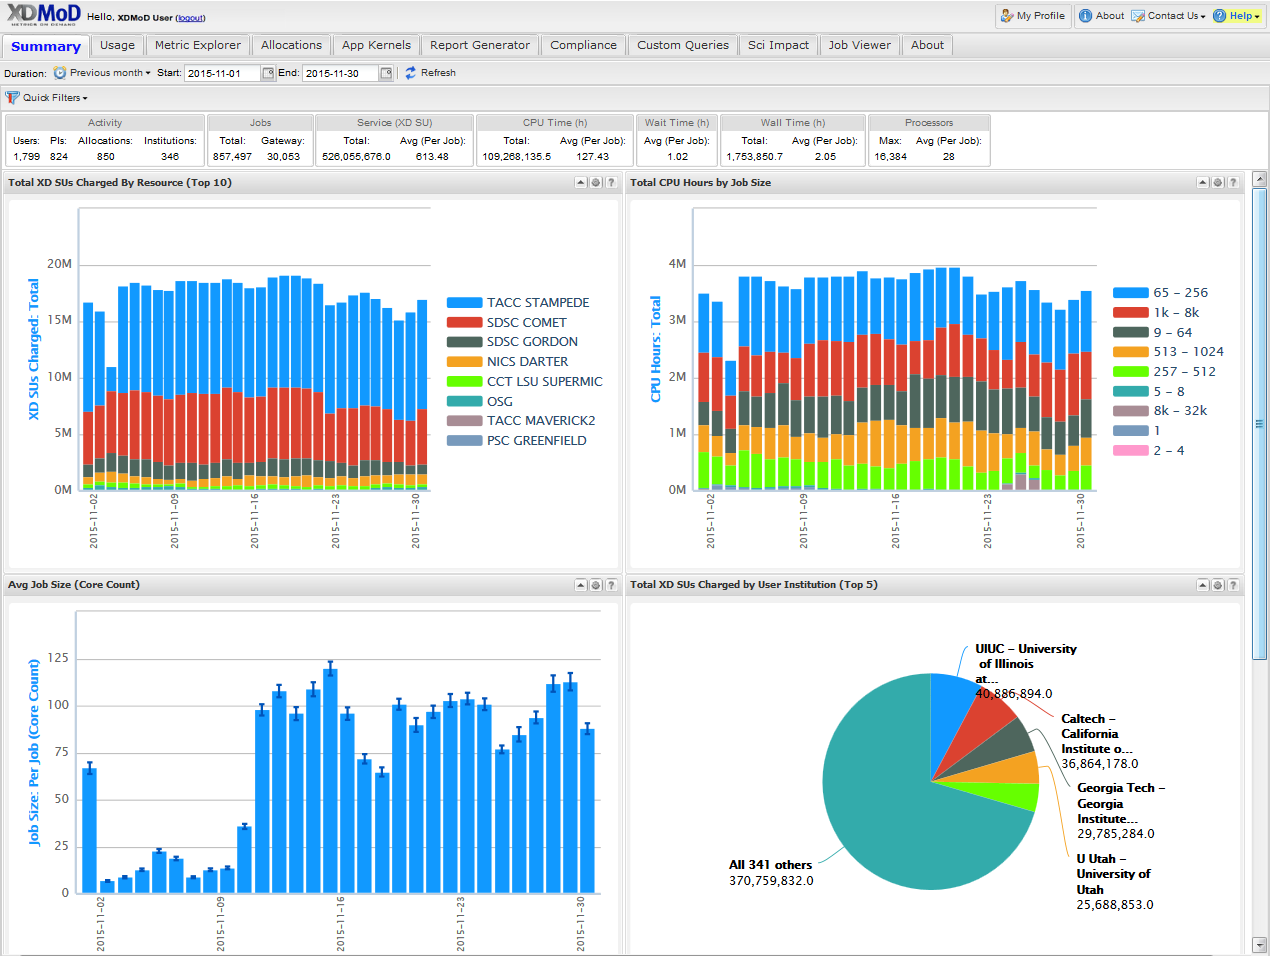
Fig. 2.1 XDMoD Summary Tab. Summary tab contains a series of user configurable summary plots of usage. In this case the summary summary plots are for all XSEDE in 2012.
The Usage tab, shown in Fig. 2.3, provides access to an expansive set of resource-wide metrics that are accessible through the tree-structure on the left-hand side of the portal window, including summaries of usage, allocations, accounts, and SUPReMM performance data. Usage metrics provided by XDMoD include: number of jobs, total and average SUs (service units) charged, total and average NUs (normalized units) provided, number of CPUs used, wait time, wall time, minimum, maximum and average job size, average CPU used, average wall time, average wait time and user expansion factor. In addition a suite of SUPReMM performance metrics are available for most resources. These metrics can be broken down by: field of science, gateway, institution, job size, job wall time, NSF directorate, NSF user status, parent science, person, principal investigator, and by resource. Many of the plots are context sensitive and allow users to click on a data element within the plot to further analyze the data. For example, in Fig. 2.3, which shows the distribution of total CPU hours by job size in 2012 for all of XSEDE, one can click on any of the columns to obtain a more detailed analysis for the selected job size range. The plot can also be made available to the custom report generator by clicking the box that reads “Available For Report”. It can also be exported in either PNG (portable network graphics), PDF (portable document format) or SVG (scalable vector graphics) format. The data itself can be exported in either CSV (comma separated values) or XML (extensible markup language) format.
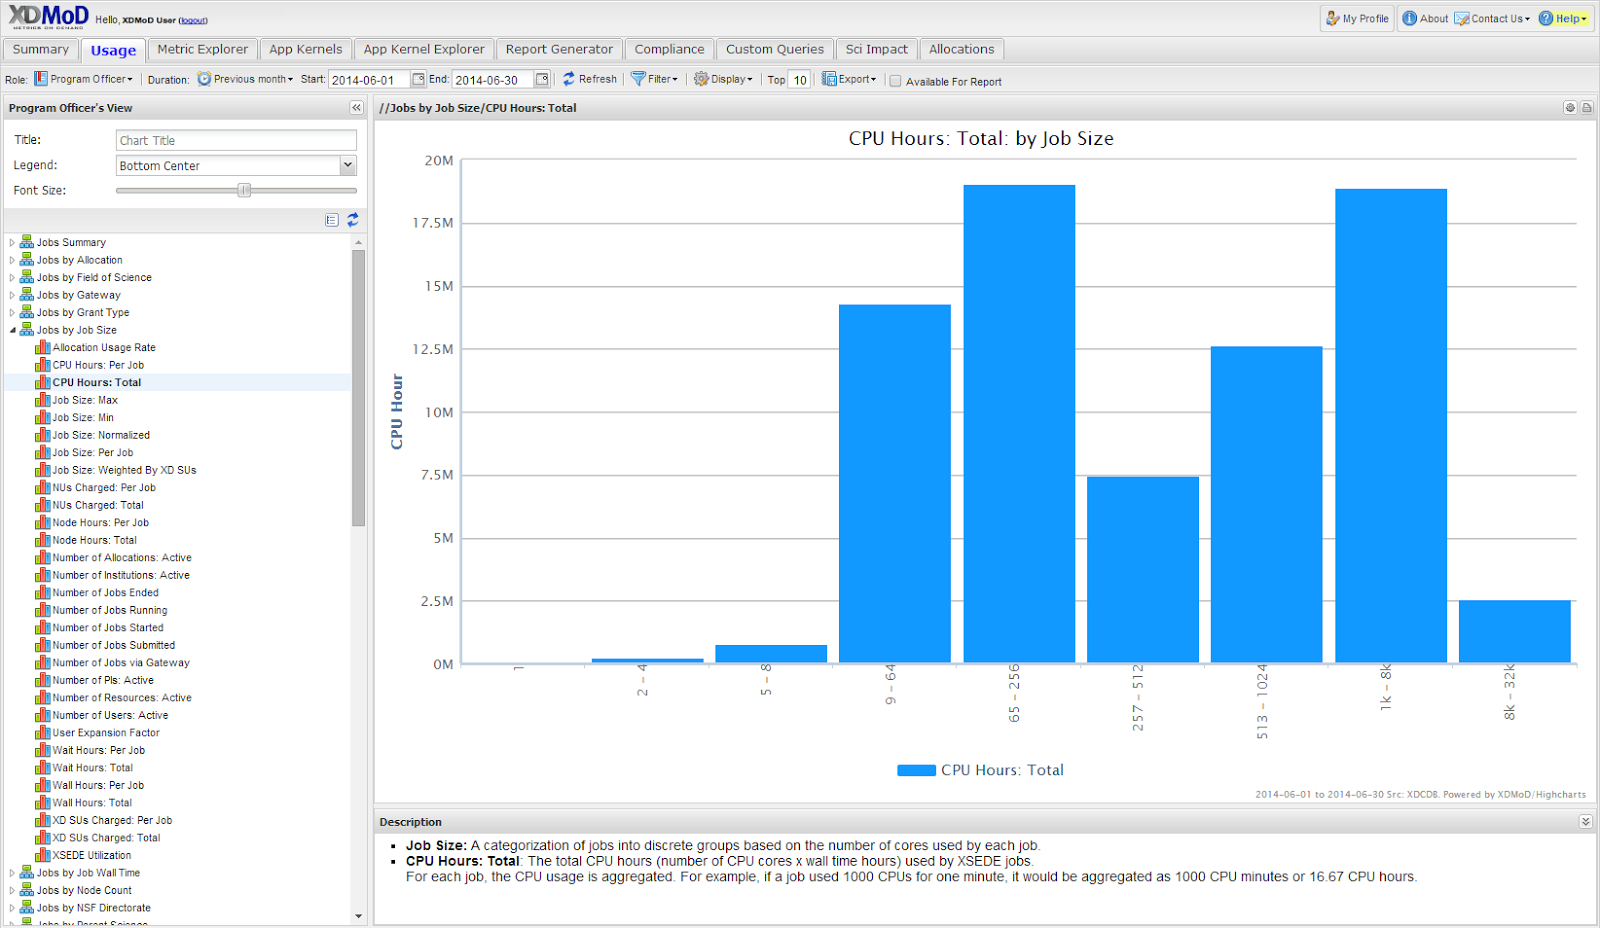
Fig. 2.3 XDMoD Usage Tab. A Usage plot showing the total CPU hours broken out by job size on all XSEDE resources for 2012.
The Metric Explorer tab provides a powerful tool for organizing and comparing the data from a wide variety of metrics. The Metric Explorer tab, which also provides access to all of the metrics available through the Usage tab, facilitates comparison among the various metrics by allowing multi-axis plots, as shown in Fig. 2.5 Displayed in the window is a plot that shows the number of jobs (left hand axis) and average core count (right hand axis) broken down by NSF Directorate in 2012 for all XSEDE resources. Biological Sciences rival Mathematical and Physical Sciences in total number of jobs but the biological-based jobs tend to use a smaller number of processors on average. As shown in Fig. 2.6, the data can be filtered in a variety of ways to display only a desired subset of the data. For example, the plot shown in Fig. 2.6 was generated from Fig. 2.5 by applying a filter to display only the “NICS-KRAKEN” data. It is interesting to note that on Kraken, Geosciences has surpassed Biological Sciences in terms of the total number of jobs run and has a much higher average core count. A notable feature is the ability to open a metric that is provided on the Usage tab directly in the Metric Explorer by clicking on the gear icon on the top right of the plot. This allows one to utilize an existing plot as a starting point and easily customize it, configure additional data series for comparison, and save it for use in a report. Taken in its entirety, the Metric Explorer provides a powerful and flexible interface to facilitate analysis of the data.
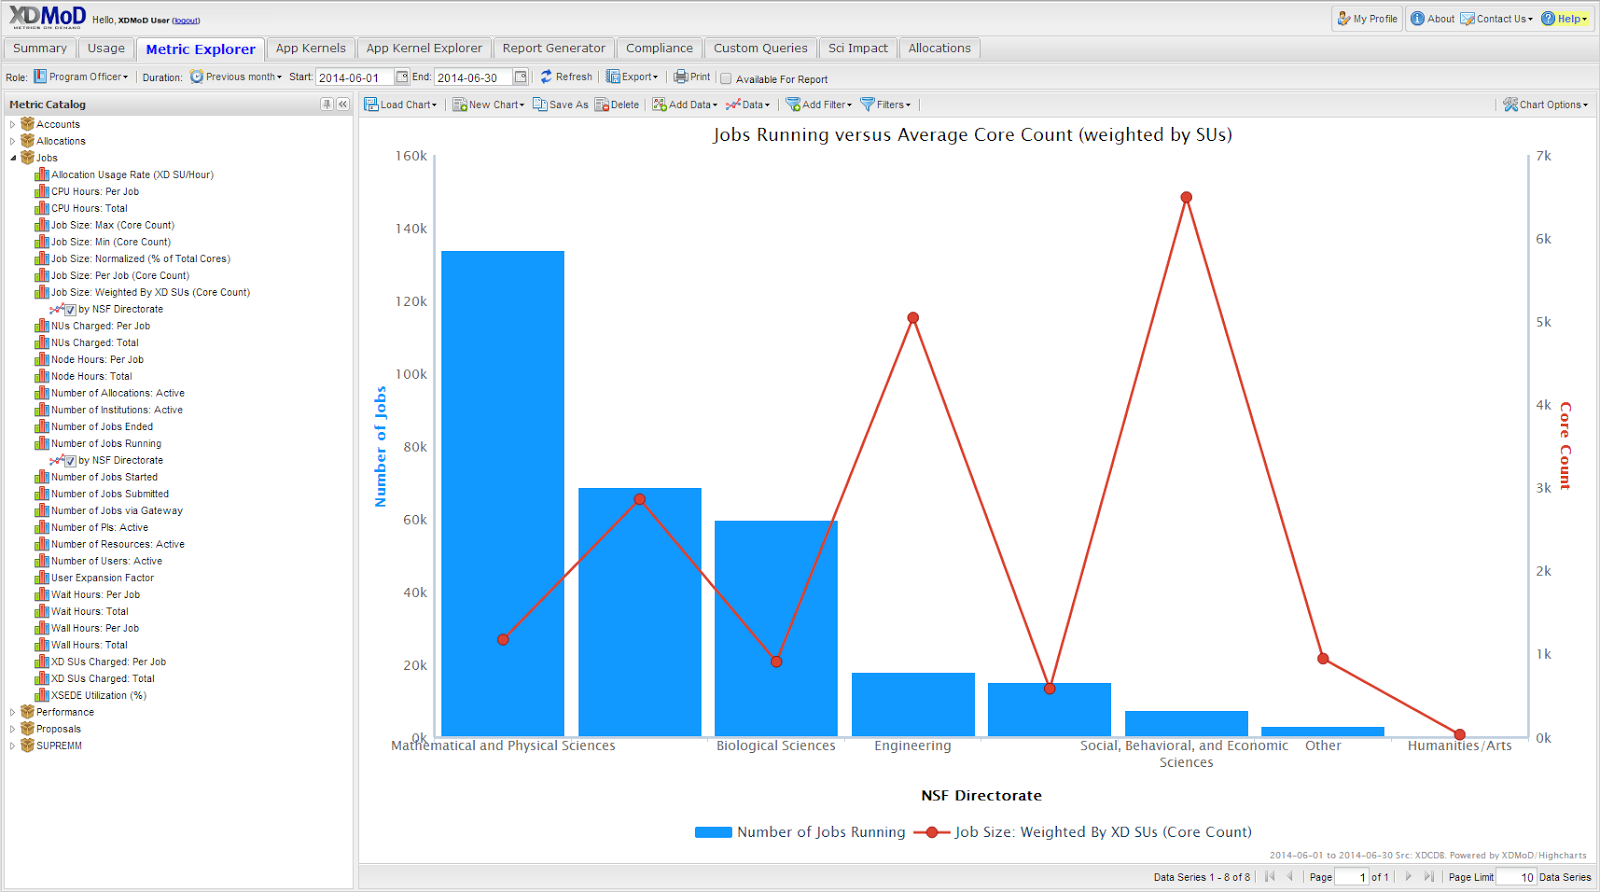
Fig. 2.5 The XDMoD Metric Explorer Tab. Plot shows the number of jobs running for each NSF Directorate vs average core count for June 2014 on all available resources. Number of jobs running is shown on the primary axis (left-hand axis) and average core count (weighted by each job’s total SU’s charged) is shown on the secondary axis (right-hand axis).
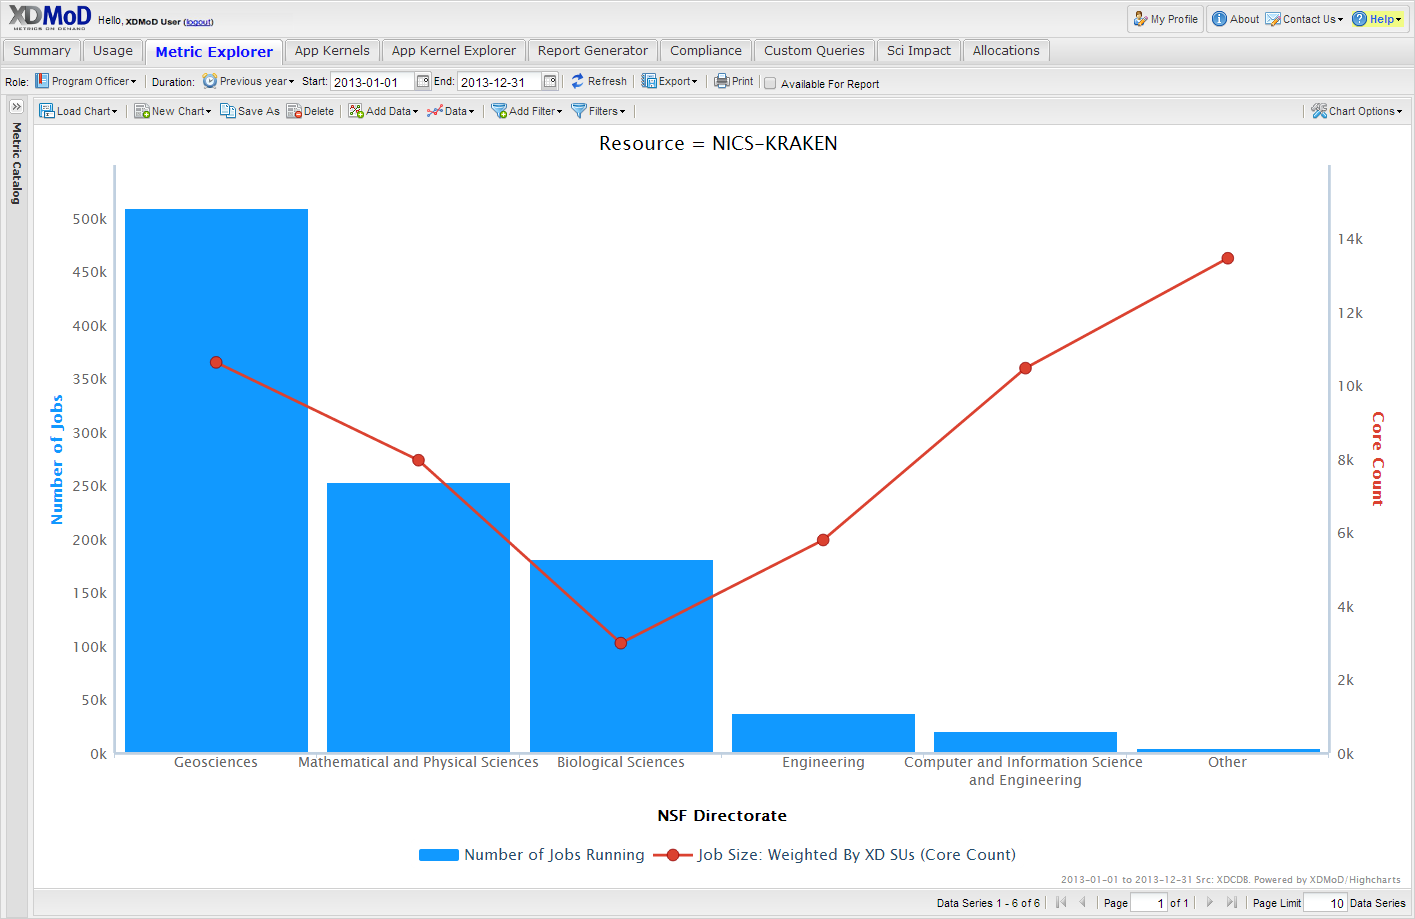
Fig. 2.6 The XDMoD Metric Explorer Tab. A Metric Explorer generated plot showing Number of Jobs Running for each NSF directorate vs Average core count on NICS-Kraken for 2013. Number of Jobs Running is shown on the primary axis (left-hand axis) and the average core count (weighted by each job’s total SU’s charged) is shown on the secondary axis (right-hand axis). Plot was generated from Fig. 2.5 by applying a filter that limited the analysis to Kraken data.
The App Kernals Tab (Fig. 2.9) contains three sub tabs that provide information on the application kernel performance and quality of service for resources. Through this tab, users can view historical performance for all application kernels run on all ACCESS resources. For example, Fig. 2.9 shows the wallclock time for Enzo benchmark run on Trestles in January 2014. Note that the plot window contains a description pane that provides information on the application kernel. The data generated by the application kernels is substantial, making the exploration of the data challenging. Therefore, in order to facilitate analysis of the application kernel performance data, we developed the App Kernel Explorer subtab. Here the user can easily select a specific application kernel or suite of application kernels, a specific set of resources, and a range of job sizes for which to view performance. It allows users to directly compare application kernel performance across multiple ACCESS resources.
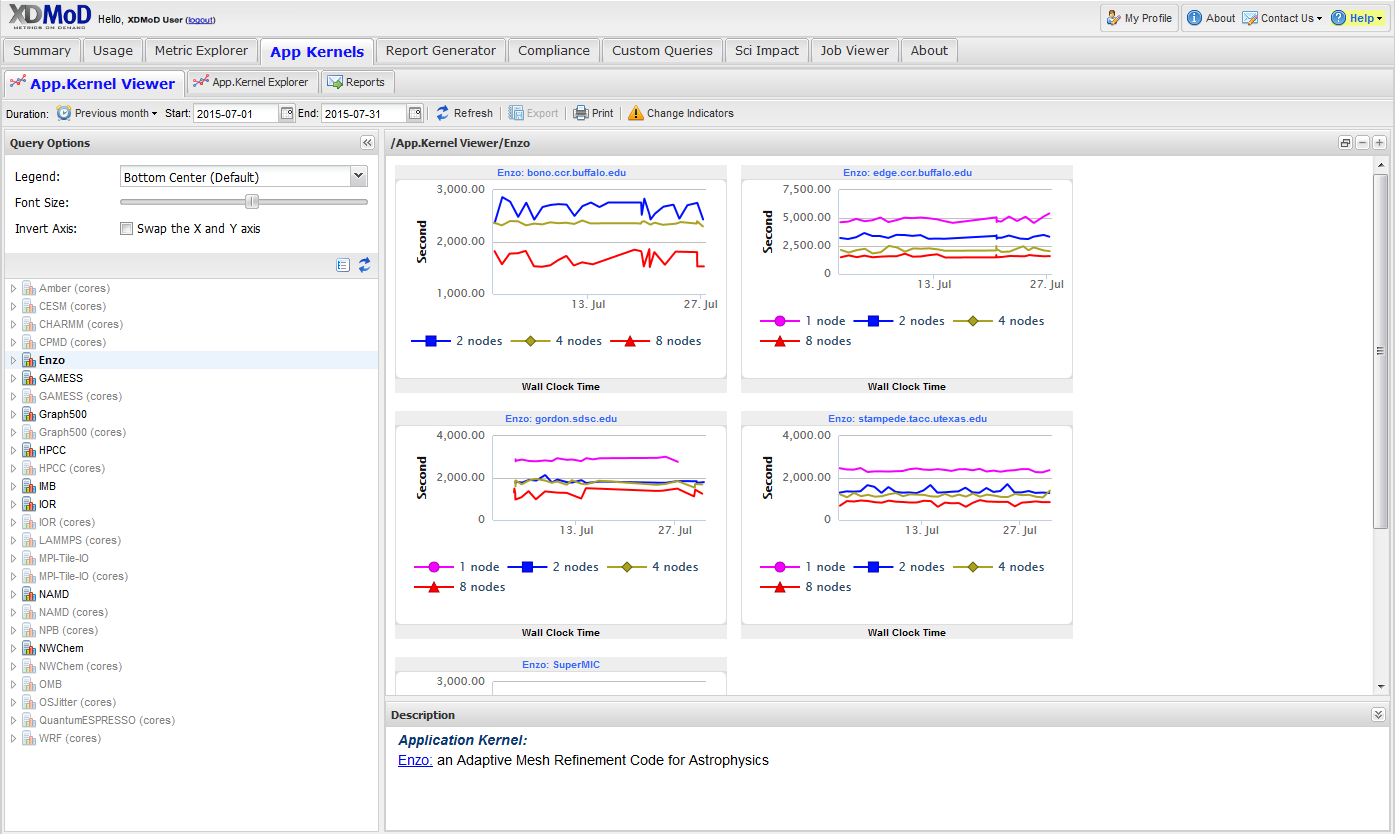
Fig. 2.9 App Kernels Tab. Plot showing wallclock time for Enzo benchmark on Trestles for June 2014. The description pane in the plot window provides more detailed information on the application kernel and the resource.
The Report Generator Tab (Fig. 2.10) gives the user access to the Custom Report Builder that allows a user to create and save custom reports. For example, a user may wish to have specific plots and data summarized in a concise report that they can download for offline viewing. The user can also choose to have custom reports generated at a user specified interval (daily, weekly, quarterly, etc) and automatically sent to them via email at the specified time interval, without the need to log into the portal.
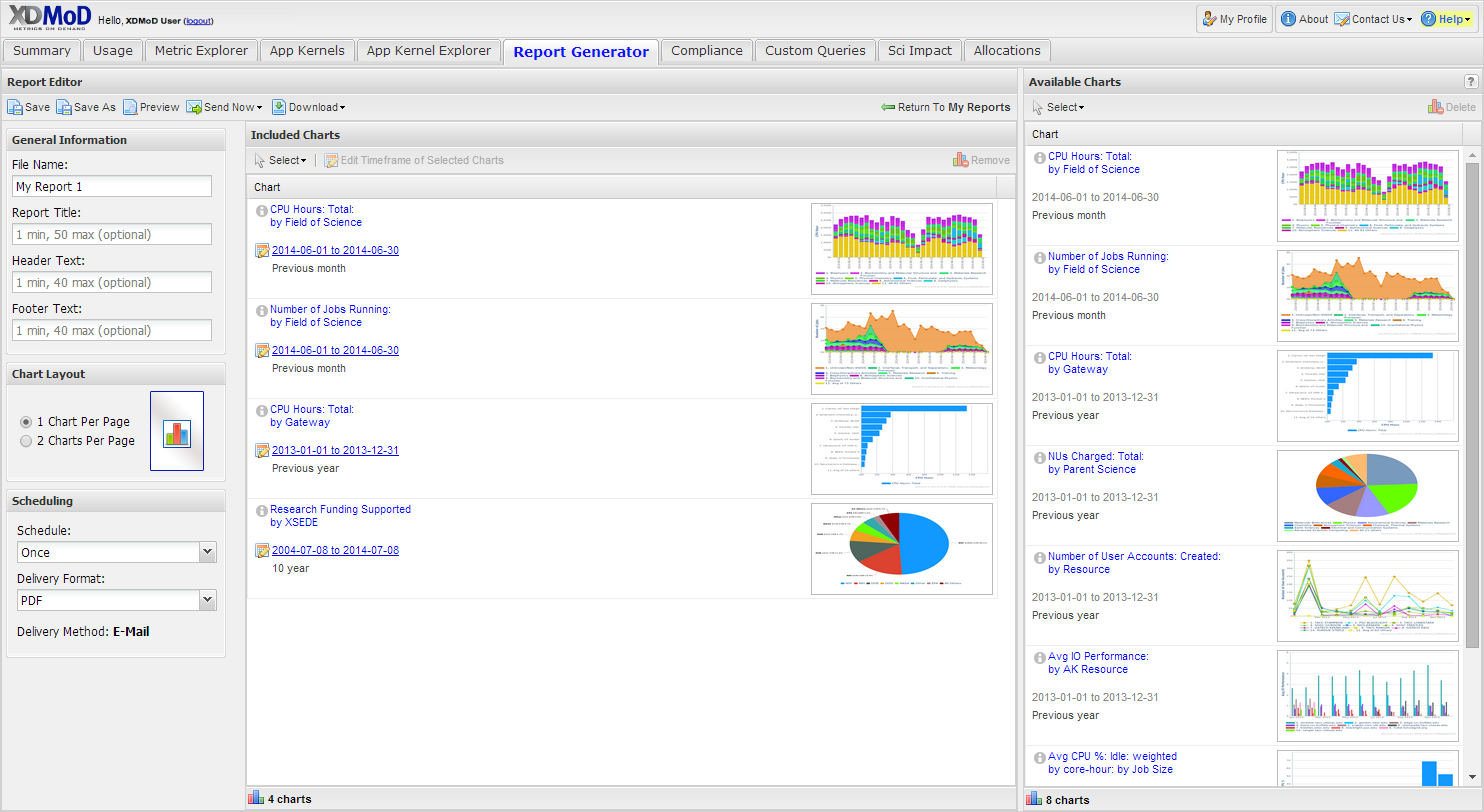
Fig. 2.10 XDMoD Custom Report Generator tab. A user can create custom reports by selecting plots from the pool of plots (right hand side) that were generated previously using the XDMoD portal.
The Job Viewer Tab (Fig. 2.11), provides the user with the capability to search for and view specific jobs or jobs that meet specified criteria. The Job Viewer displays job accounting and performance data for any job for which this information is available in the XDMoD data warehouse. There are two basic ways to search for and view jobs using the Job Viewer. If the local job id and resource are known, the quick job lookup function can be used to locate the detailed data for the job. If a job or jobs fitting a given set of criteria are desired the Advanced search function can be used to locate all jobs fitting the specified criteria.
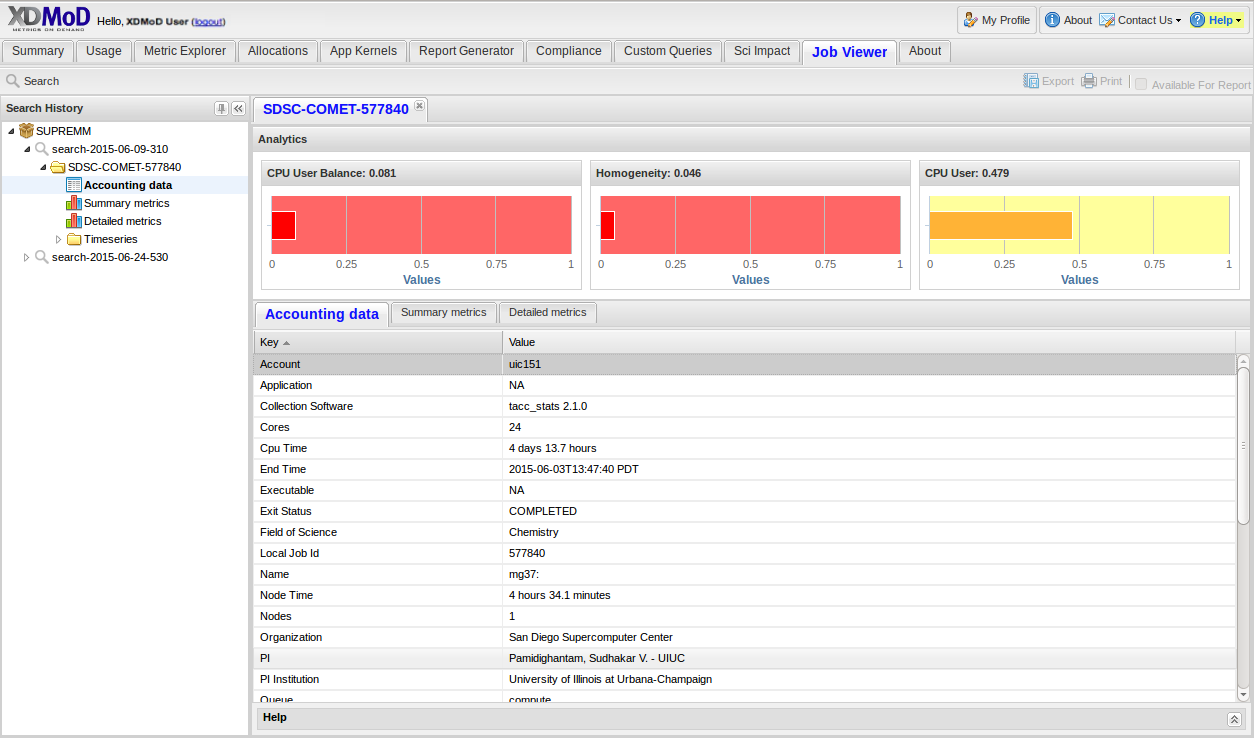
Fig. 2.11 Job Viewer Tab
On occasion, NSF program officers and ACCESS management have made requests for reports or comparisons that do not fit into the existing data realms or plotting tools provided by XDMoD. The Custom Query tab, shown in Fig. 2.12 and available only to users with the Program Officer role, has been designed as a mechanism for fulfilling these requests without requiring substantial modification of existing XDMoD internals. Servicing these requests often requires custom back-end programming by the XDMoD team, the incorporation of potentially inconsistent data sources, and substantial data sanitization work. While these queries may be incorporated into XDMoD in the future, the Custom Query tab provides a more efficient way to quickly view the requested data while providing familiar user interface elements such as the date selector, plot export tools, and inclusion of plots into custom reports. Examples of custom queries include research funding supported by ACCESS (directly and indirectly) and NSF research funding supported by ACCESS (overall as well as restricted to MPS). In fact, discoveries during the generation of these queries have resulted in requirements to improve the quality of data collected by the ACCESS allocations process.
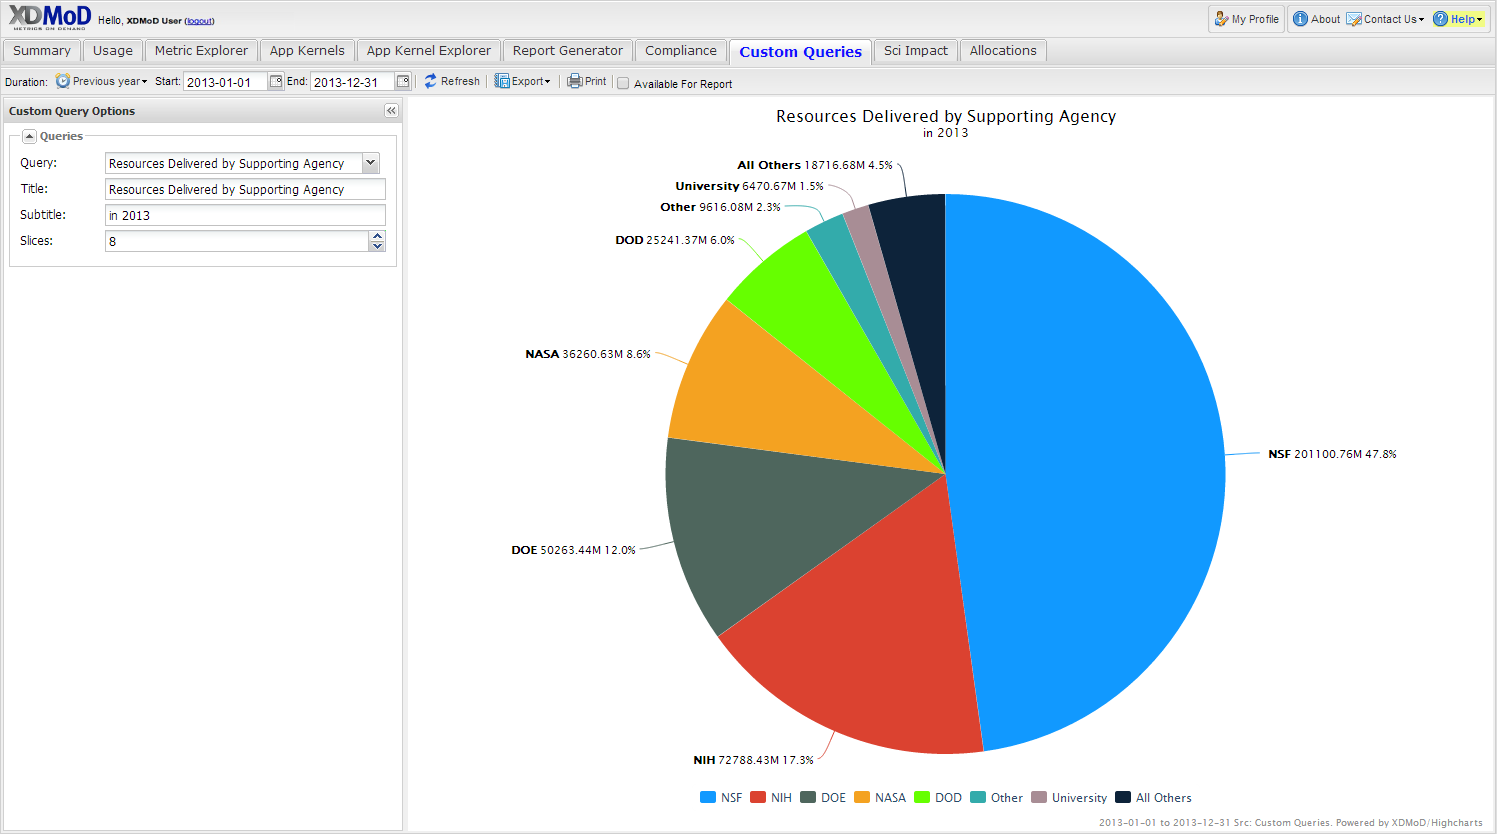
Fig. 2.12 Custom Query tab showing number of SUs delivered in 2013 by supporting funding agency
A Compliance Tab was added to the XDMoD framework to provide service providers, NSF Program Officers and ACCESS leadership with a tool to quickly assess service provider compliance with ACCESS operational reporting requirements and TAS recommendations. The new compliance tab tracks whether or not each service provider is supplying required reporting metrics and data.