8. Usage Tab

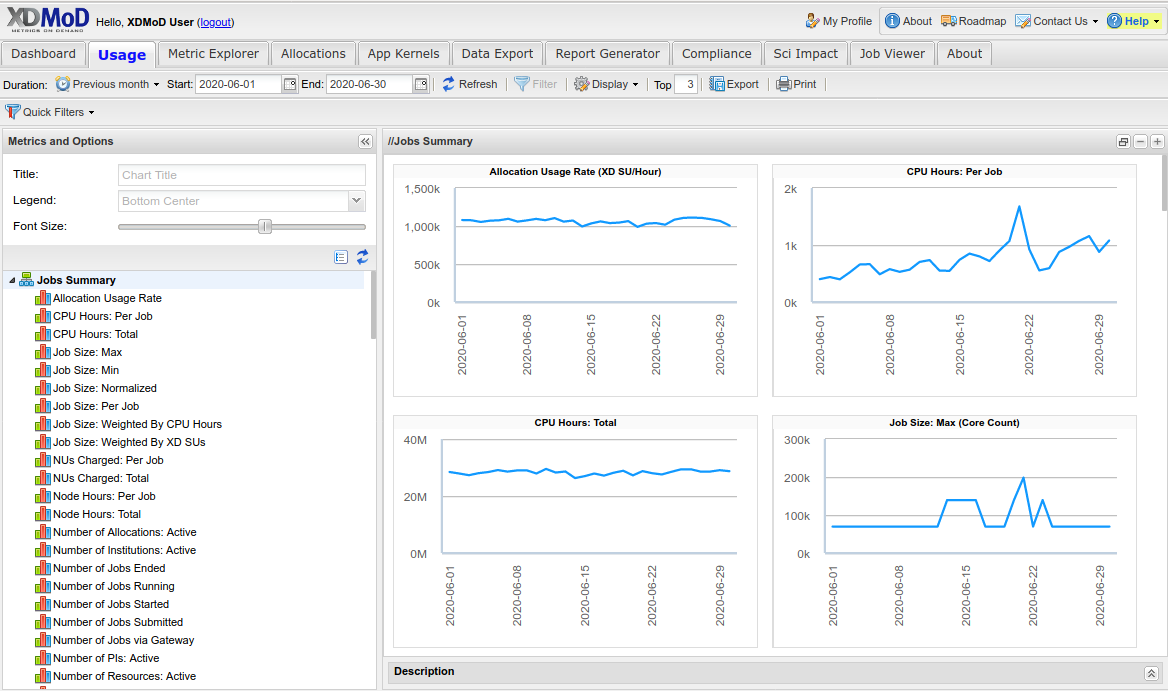
Fig. 8.1 Usage Tab
The Usage tab (Fig. 8.1) provides a convenient way to browse XDMoD’s realms. It consists of a chart selection tree on the left, and a chart viewer to the right of the page. You can interact with the chart selection tree to explore the realms and view individual metric charts.

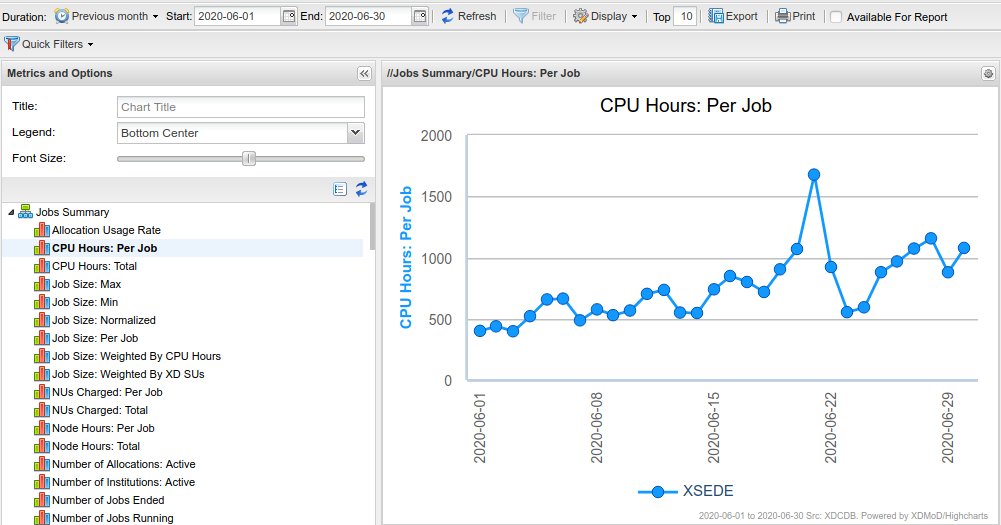
Fig. 8.2 Usage Tab Metric
To view a metric in the Usage tab (Fig. 8.2), expand the selection tree and select an item. The CPU Hours Per Job metric from the Jobs realm is shown. You can use the Duration and Chart Configuration controls to customize the chart (Refer to section “Common User Interface Elements”). For example, you can:
Change the data duration
Change the plot’s display
Note that any selection in the Duration control applies to all charts in the Usage tab.

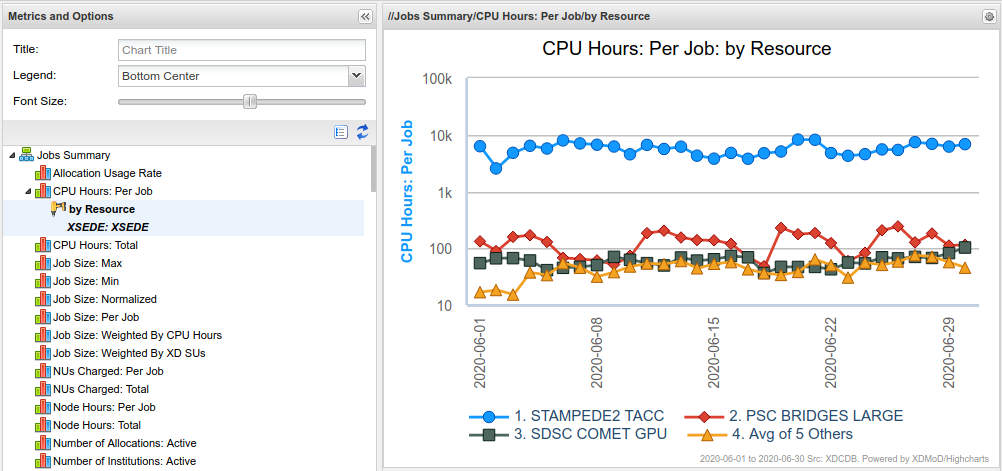
Fig. 8.3 Usage Tab Drilldown
You can drill down on a metric in the Usage tab (Fig. 8.3) by left-clicking on the plotted data and selecting a dimension. Drilldown of CPU Hours Per Job by Resource is shown. To further customize the plot, you can use the configuration controls, or export the plot to Metric Explorer by clicking the Gear icon at upper right of the plot window.