6. Summary Tab

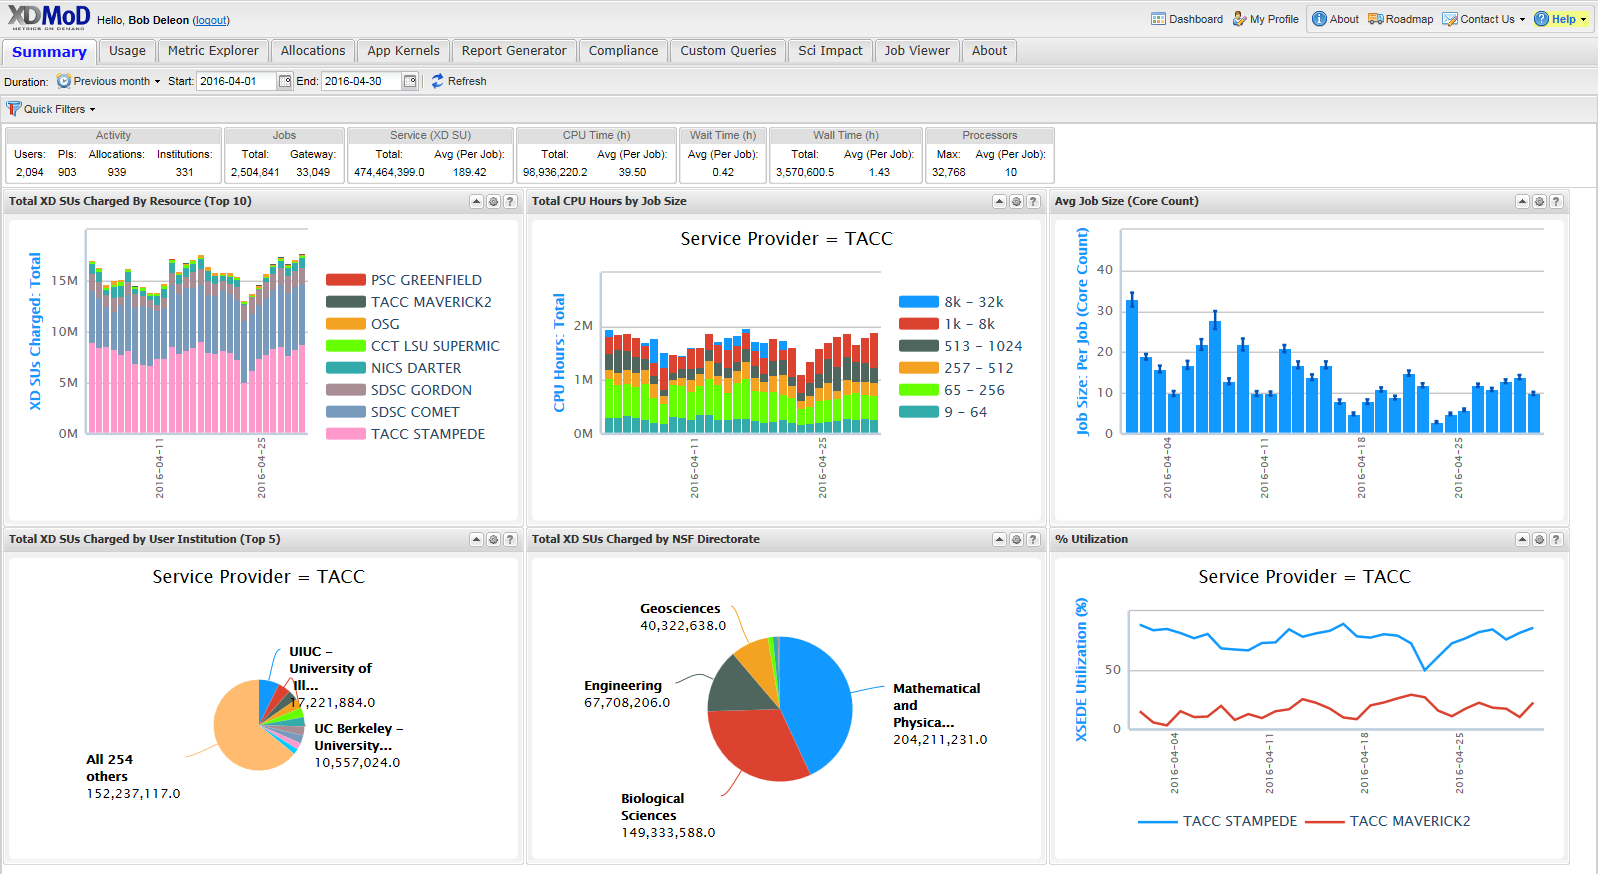
Fig. 6.1 Summary Tab
The Summary tab (Fig. 6.1) consists of a duration selector toolbar, a summary information bar, followed by a select set of charts representative of the usage. The refresh button can be used to reload the page.
The Summary tab provides a dashboard that presents summary statistics and selected charts that are useful to the role of the current user. Pertinent information such as the number of jobs run, average CPU time per job, and the average number of processors per job are displayed as well as selected charts that provide an overview of selected available data. For ACCESS this includes the operation of ACCESS as a whole, a particular Resource Provider, or the state of jobs run by the current user.
To access a more detailed and configurable version of each chart in the Summary tab, click on the gear icon to the right of the chart title (see Fig. 6.3 below).
Consult the Quick Filters drop-down menu in the upper-left corner to see summary content tailored to specific roles (Fig. 6.3).
Based on the user’s role in the XDMoD, the Summary page may show your jobs (for user role), those of your group (for PI role), those of your resource (for center director role) or ACCESS as a whole (for program manager role).

Fig. 6.3 Summary Portlet Tools |
From left to right, this toolbar provides a button for collapsing the portlet, a button to configure the chart, and a button that when hovered over will present a tooltip to describe the data in the chart. |