14. Report Generator
To manage reports, click on the Report Generator tab.
The default view of the Report Generator UI is shown below. The left region provides a listing of any reports you have created. The right region displays any charts you have chosen to make available for building a report (see “Available For Report” check box. section).

Each report entry present under the Report Generator tab displays the title of the chart, whether it was generated manually or from a template, the delivery schedule, the delivery format and the number of charts. In the Available charts section each chart has its title, the timeframe of interest, and a thumbnail view. The time frame defaults to the one chosen prior to making the chart available for reporting.
If you create a chart by a process that includes at least one filtering step and choose to make that chart available for reporting, information on the filtering and drilldown processes can be viewed in by moving your mouse over the information icon to the left the chart title in the chart entry as shown in Fig. 14.1.

Fig. 14.1 Viewing additional details for a chart entry
The top toolbar serves as the starting point for managing a report.

Fig. 14.2 Report Generator toolbar
New: Creates a new report. A default (and unique) name will be chosen, and no charts will be included.
New Based On: Creates a new report which contains all the charts and settings of an existing report. A default (and unique) name will be chosen and assigned to this report.
Edit: Opens an existing report for editing.
NOTE: Another way to open a report for editing is to double-click on one of the entries in My Reports:

Fig. 14.3 Editing a report
Preview: Previews the (selected) report prior to sending it.
Send Now: Builds and sends the (selected) report to the email address associated with the user.
Download: Builds the (selected) report and presents it to the user as a downloadable file.
14.1. Selection Model
All the lists / grids under the Report Generator tab have been designed such that multiple selections can be made for more efficient workflows.
Clicking on one entry, followed by holding shift while clicking another entry results in the selection of both entries along with all the entries that fall in between them:

Fig. 14.4 Selecting charts for addition in a report
Clicking on one entry, followed by holding the control key (or command key on a Mac) while clicking another entry results in individual selections being added (appended) to what is currently selected.

Fig. 14.5 Another method to select charts for addition in a report
Note: Deselections can be made by clicking on selected items in the grids while holding down the control key (or command key on a Mac).
Whether you choose to create a new report or edit an existing report, you will be directed to the Report Editor:

Fig. 14.6 Selecting reports and charts via the Select menus
An alternative way to select reports and charts in the Report Generator is to make use of the Select menus (as highlighted in Fig. 14.5 a and Fig. 14.5 b). Using these select menus is especially helpful if you are dealing with a substantial number of reports or charts. The select menus also gives you the ability to invert selections made in the report and chart grids. In other words, when you click on Invert Selection, any items previously selected will become deselected, and vice-versa (see Fig. 14.5 c).

Fig. 14.7 Report editor

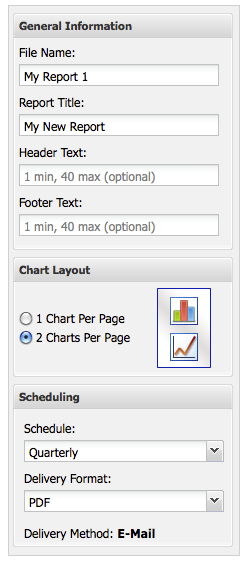
Fig. 14.8 Information to be entered to customize a report |
General Information for this report
is displayed on the left side of the
Report Editor. The only required field
is the report File Name, which must be
unique. When creating a new report
(including a new report based on
another report), a default unique file
name will be generated and assigned to
the File Name field. The Chart Layout section allows you
to control how many charts are to
appear on a single page. The Scheduling section allows you to customize the frequency in which reports are to be sent to your email address (associated with your account). Schedule options include Daily, Weekly, Monthly, Quarterly, Semi-annually, and Annually. To disable automatic delivery of reports, set the Schedule option to Once. Currently available formats for reports are PDF and Word Document. |
To add charts to a report, simply drag an entry from the list of Available Charts (on the right-hand side) into the Included Charts list. See the section entitled Selection Model for adding multiple charts at once.
The order in which the charts appear in the Included Charts section of the Report Editor dictates the order in which they will appear in the report. Re-ordering of charts in the report can be accomplished by simply dragging the charts into the desired order:

Fig. 14.9 Reordering charts in a report
14.2. Changing Chart Timeframes
Should you decide (during the report building process) that you want to
change the timeframe of a given chart, you can easily accomplish this
task by either clicking on the timeframe or the edit icon  to
the left of the time frame in the respective chart entry. As a result,
you will be presented with a dialog for conveniently updating the
timeframe to your liking.

Fig. 14.10 Changing the timeframe of a chart entry in the report editor
Note: If you want to edit timeframes for multiple charts in a report, select two or more charts, then click on the Edit Timeframe of Selected Charts button in the top menu. Doing so will bring up the same Edit Chart Timeframe dialog as mentioned above. When you click on Update, each of the charts you had previously selected will update to reflect the new timeframe you specified.

14.3. Previewing a Report
At any time during the report editing process, you may preview the current state of the report by first saving and then pressing the Preview button (previewing reports is also possible from the My Reports view):

Fig. 14.11 Previewing a report
14.4. Building, Exporting Reports
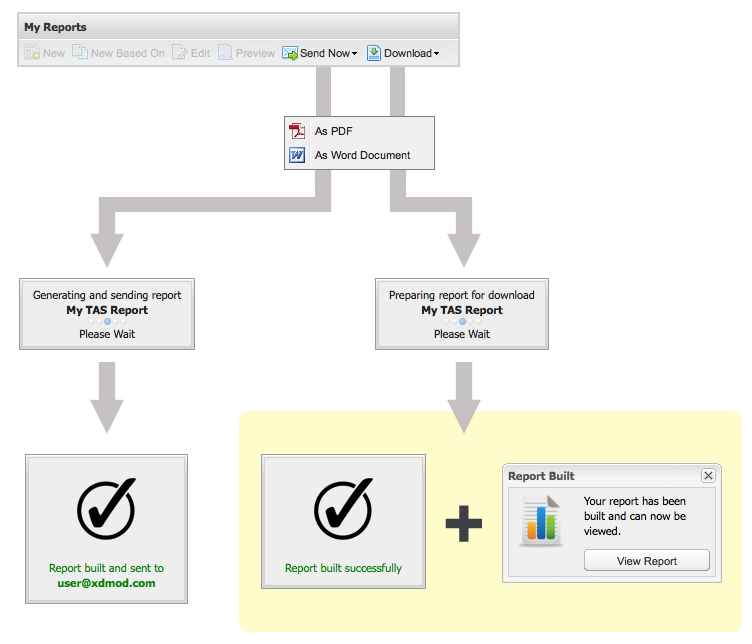
To build the report (as a PDF or MS Word document), you can make use of the Send Now and Download options available from any of the following sections: My Reports, Report Editor, and Report Preview. The Download feature will allow you to immediately access or download the resulting document, whereas the Send Now feature will email the constructed report to the address associated with your profile (see the My Profile Button section).

Fig. 14.12 Sending a report with Send Now or Download
14.5. Report Templates
Report templates allow you to easily construct a set of reports, complete with charts. This is particularly useful for System Providers, for example, who want to acquire comprehensive information regarding their resources without having to go through the time-consuming task of navigating XDMoD and hand-selecting a series of charts.

Fig. 14.13 Creating reports from templates |
At this moment, report template functionality is only available to center-based roles (e.g. Center Directors and Center Staff members). If no reports have been selected, clicking on New Based On will simply present a menu of the available templates for you to use. If a report has been selected prior to this action, then that report will appear at the top of the list followed by available templates. This gives you the option of either cloning an existing report or deriving a new report from a template. Fig. 14.13 a illustrates this logic. If your account is associated with multiple centers, you will be able to select the center from which to derive reports. The template you select will direct you to a sub-menu consisting of the centers associated with your XDMoD account. At this point, simply select the center you want to generate reports for. Fig. 14.13 b illustrates this. |
If you were to select Template: SP Quarterly Report, for example, XDMoD will automatically acquire the most informative charts per resource belonging to the center of interest, and create a report for each resource discovered. The Reports Overview window will automatically refresh itself and present you with the reports derived from the template.
Each generated report would be configured for quarterly delivery, and each of the included charts would be based on the previous quarter.