10. Job Viewer
The Job Viewer Tab displays information about individual HPC jobs and includes a search interface that allows jobs to be selected based on a wide range of filters. An example of the job viewer tab is shown in Fig. 10.1. The main components of the job viewer are the search history pane and the main viewer pane. The search history pane uses a tree menu that shows all saved searches as nodes in the tree. The jobs that were selected in each search are listed under their respective search node. The main viewer pane has a tabbed user interface that shows the information for a selected job with one job per tab. The different types of information within a job are shown in sub-tabs.
Note that the information available for a given job depends on the data collection software being collected.
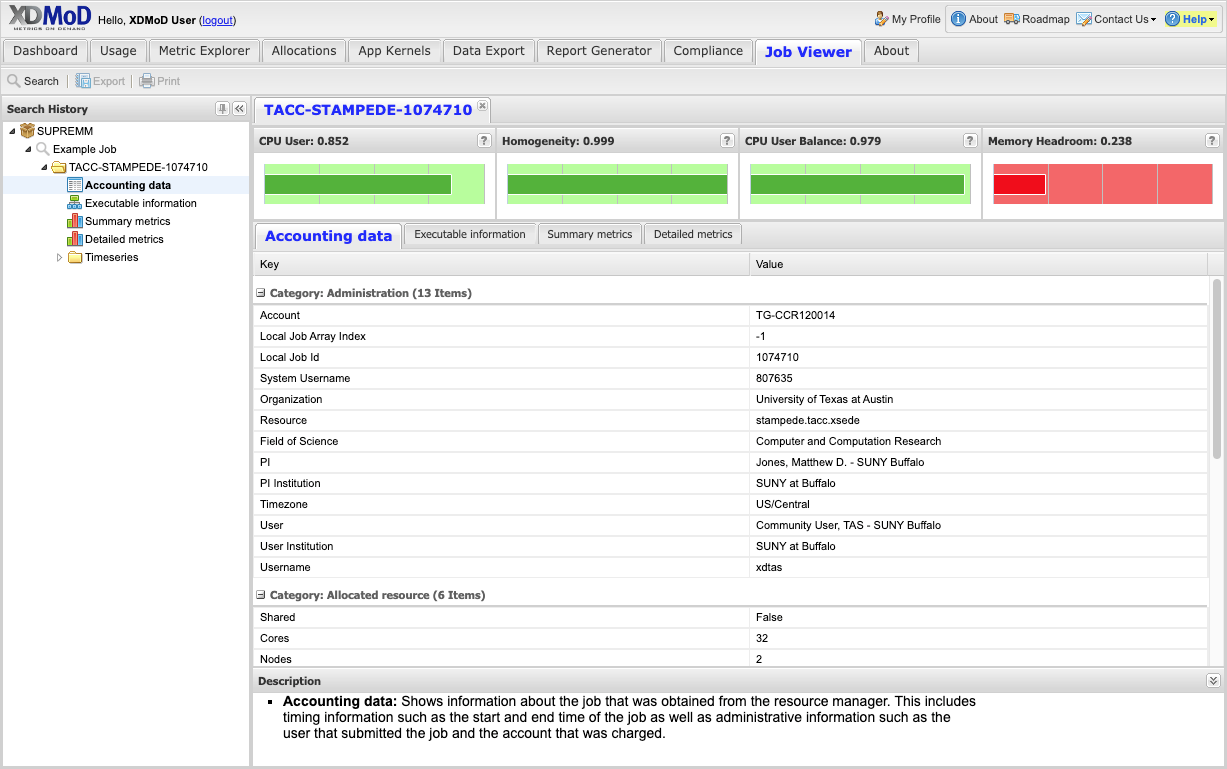
Fig. 10.1 Job Viewer Tab
10.1. Searching for jobs
There are two ways to search for jobs. If the job id is known, the quick job lookup function can be used to locate the detailed data for the job. Alternatively, the Advanced search function can be used to find jobs based on one or more search parameters.
To activate the Job Viewer click on the Job Viewer tab, then on the Search button in the upper left corner. This will bring up the Search window (shown in Fig. 10.2). The search window has three main components, the Quick Job Lookup form, the Advanced Search form and the Results panel. Use the Quick Job Lookup form to find a known job based on its job id (i.e. the identifier that the job was assigned by the job scheduler). First choose the Resource on which the job ran from the drop-down list. Next enter the desired job number in the Job Number box. Finally click on the Search button in the lower right corner of the form. If there is information for this job in XDMoD then a record will show in the results pane. You may optionally choose a descriptive name for the job search in the Search Name entry box and then click Save Results to add the job to the search history for viewing.
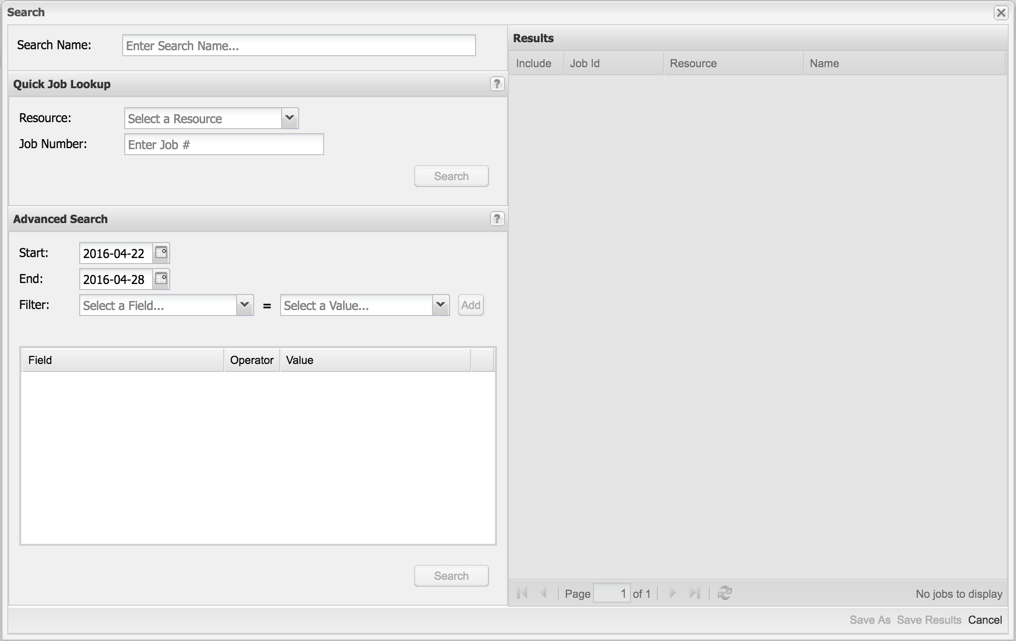
Fig. 10.2 Search Window
Alternatively, if you are looking for jobs that satisfy a general set of criteria, you can use the Advanced Search form (see Fig. 10.3). You must specify (1) the time frame for the search as well as (2) one or more Filters. The filter field is selected from the drop down list, the value for this field is then selected from the box to its right and then click on the Add button to add the filter to the search. Multiple filters can be added to the search and the same filter field may be added multiple times with different values. You can optionally enter a descriptive name for the search in the Search Name entry box (3).
After the inputs have been completed, click on Search (4). If there are any jobs that fit the given search criteria, a list of jobs will be displayed. You can select specific jobs that you would like to view by checking the box next to the job ID, (5) then click Save Results (6) to add the selected jobs to the search history for viewing.
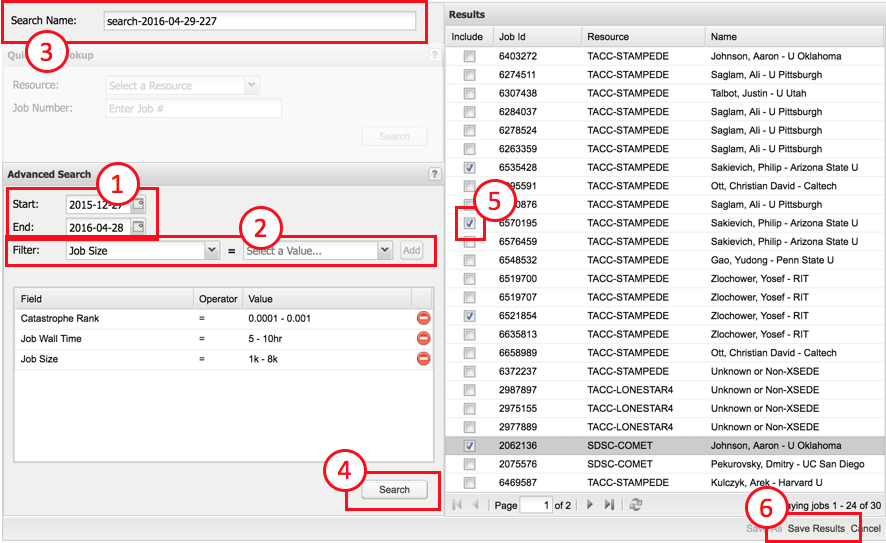
Fig. 10.3 Using the Advanced Search Form in the Search dialog.
10.2. Viewing job data
Job information may only be viewed for jobs that are in the search history. The search history tree on the left hand side of the interface shows the saved searches. An annotated example of a search history tree is shown in Fig. 10.4. The tree shows all saved searches, all selected jobs for each search and the list of data available for each job. Selecting a data node for a job will result in the job data loading in the main viewer pane.
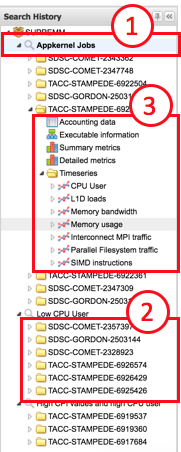
Fig. 10.4 Job viewer search history tree. The tree shows every saved search (1), all selected jobs for a search (2) and the data available for each job (3)
The different types of data available for a job are listed below:
At-a-glance analytics
Accounting data
Job script
Executable information
Summary metrics
Detailed metrics
Timeseries plots
Note that not all data may be available for all jobs. Availability of data depends on the collection software installed on the HPC resource as well as the hardware capabilities on the compute nodes. The only information that is guaranteed to be present is the Accounting data.
10.2.1. At-a-glance analytics
The at-a-glance analytics are shown at the top of the job tab and are automatically displayed if they are available (there is no data node displayed in the search history for the at-a-glance analytics). There are three plots that show a summary of the values of selected performance metrics of the specific job. The metrics that are displayed here are normalized with values near 1 (displayed in green) indicating a good value and values near 0 (displayed in red) indicating a poor value for the metric. We note that not all jobs should be expected to have good values for all metrics. The default metrics that are displayed are CPU User Balance, Homogeneity, Memory Headroom and CPU User (see Fig. 10.6). CPU User Balance indicates how well balanced the usage is between the various cores in the job based on the fraction of time each core spends in CPU user mode. CPU User Balance is defined as
\(CPU\ User\ Balance\ = \ 1\ - \frac{CPU_{max\ } - \ CPU_{\min}}{CPU_{\max}}\)
where \(CPU_{\max}\) is the CPU usage for the core with the highest average usage and \(CPU_{\min}\) is the CPU usage for the core with the lowest average usage. A value near 1 is ideal in that all cores are working equally; a value near zero indicates that one or more cores are nearly idle. Homogeneity is a measure of how uniform the L1D cache load rate is over the lifetime of the job. The L1D load rate is a useful metric measuring if the job is accomplishing useful data processing. High values near 1 are good; if the value is low near 0, the job should be investigated to determine if data processing terminated prematurely. CPU User is the ratio of CPU clock ticks spent in the CPU user mode summed over all of the cores divided by the total clock ticks for the job for all of the cores. Values near 1 are ideal indicating that all cores are spending most of their time in CPU user mode. Values near 0 indicate a job where the cores are spending only a small fraction of their time in CPU user mode.
10.2.2. Accounting data
This tab shows the information about individual jobs obtained from the ACCESS allocation service . This includes timing information such as the start and end time of the job as well as administrative information such as the user that submitted the job and the account that was charged.
10.2.3. Job script
This tab shows the job batch script that was passed to the resource manager when the job was submitted. The script is displayed verbatim.
10.2.4. Executable information
This tab shows information about the processes that were run on the compute nodes during the job. This information includes the names of the various processes and may contain information about the linked libraries, loaded modules and process environment.
10.2.5. Summary metrics
This tab shows a table with the performance metrics collected during the job. These are typically average values over the job. The label for each row has a tooltip that describes the metric. The data are grouped into the following categories:
- CPU Statistics: information about the cores on which the job was
assigned, such as CPU usage, FLOPs, CPI
- File I/O Statistics: information about the data read from and written
to block devices and file system mount points.
- Memory Statistics: information about the memory usage on the nodes on
which the job ran.
- Network I/O Statistics: information about the data transmitted and
received over the network devices.
10.2.6. Detailed metrics
This tab shows the data generated by the job summarization software. Unlike the summary metrics listed above, this data is not normalized and the format and content is specific to the job summarization software used. Please consult the relevant job summarization software documentation for details about these metrics.
10.2.7. Peers
This tab shows a Gantt chart representation of all other HPC jobs that ran concurrently using the same shared hardware resources. The peers tab has the ability to drill down on the jobs that run concurrently by clicking on a peer’s data. Note: For jobs with many peers, it is recommended to hover over the start or end of a job due to tooltip displacement (see Fig. 10.5).
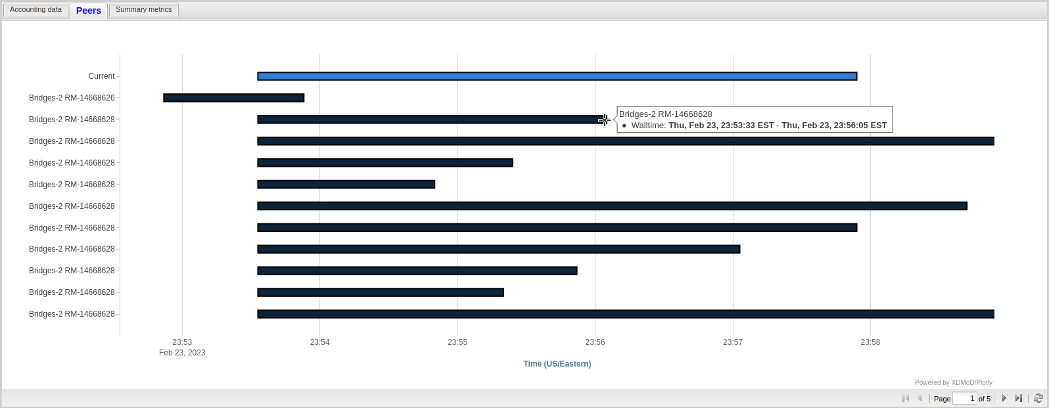
Fig. 10.5 Peer Charts
10.2.8. Timeseries plots
The final aspect of the Job Viewer tab is the ability to view timeseries plots of several different metrics. The available plots for a job are listed under the Timeseries tree node in the search history (see Fig. 10.4). The metrics that are available depend on the collection software that runs on the compute nodes as well as the hardware on the nodes themselves. A brief description of the metrics follow:
- CPU User: The ratio of time spent in user mode to total CPU time for
the cores that were assigned to the job.
- L1D loads: The ratio of L1D cache loads to reference CPU clock ticks
for the cores that were assigned to the job.
Memory bandwidth: The rate of data transferred to DRAM.
- Memory Usage: The memory usage reported by the OS for the nodes that
were assigned to the job.
- Interconnect MPI traffic: The rate of data transferred over the
high-speed interconnect
- Parallel filesystem traffic: The rate of data read from and written
to the parallel filesystem
- SIMD instructions: The rate of SIMD instructions (this is correlated
to the number of floating point operations).
- Process memory: The amount of memory used by the processes that were
run by the job
- NFS Filesystem traffic: The rate of data read from and written to NFS
mounted filesystems.
It is possible to drill down on the timeseries data by clicking on the data series on the chart or by using the search history tree. The degree to which it is possible to drill-down varies according to the metric. For example, the CPU metric shows the compute node-level average values and it is possible to drill down to the per-core values. The memory metric shows the compute node-level average value and it is possible to drill down to the individual NUMA nodes (for supported collection software).
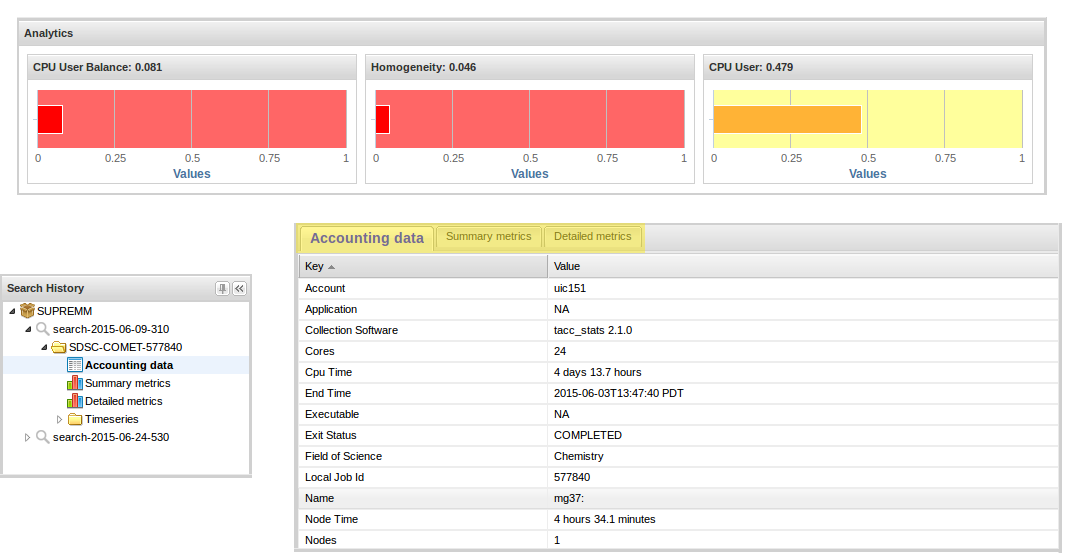
Fig. 10.6 Job Viewer Information
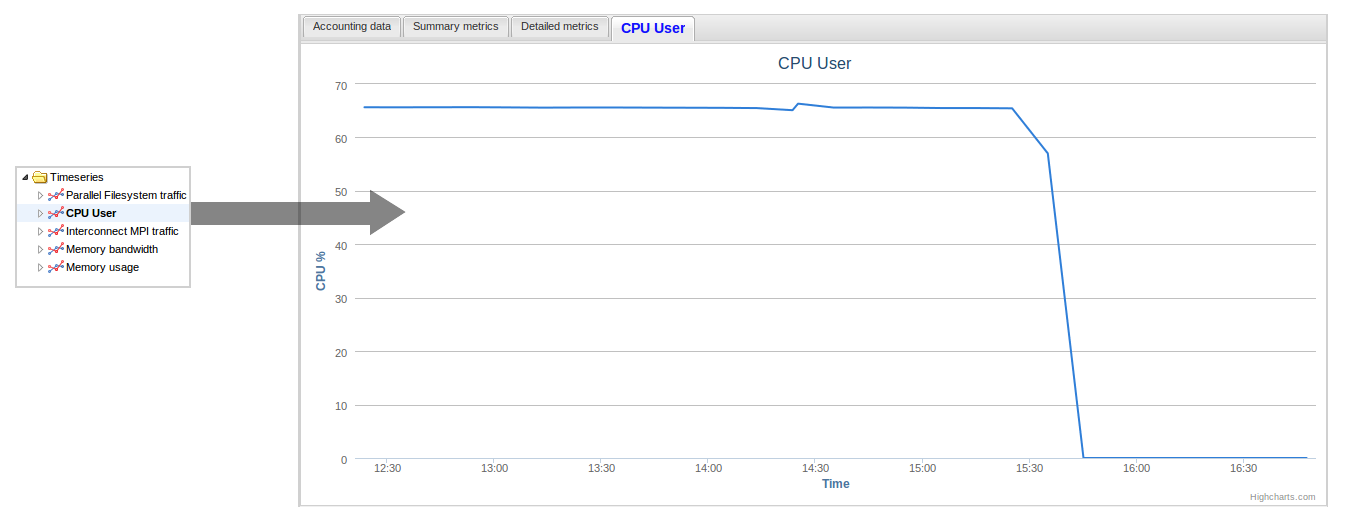
Fig. 10.7 Chart vs Time